Costs by Industry | 2019 UBA Health Plan Survey Trends

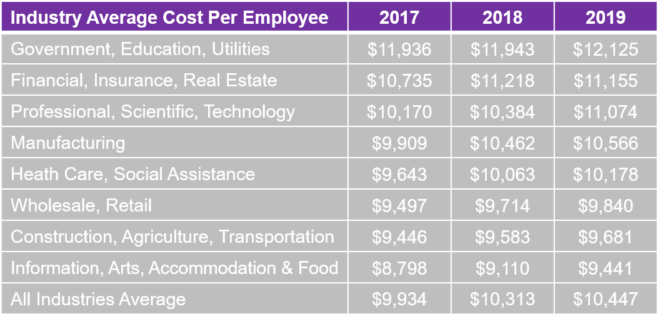
The government/education/utilities sector has the priciest plans, at $12,125 per employee, up just 1.5% from last year. Total costs per employee for the construction/transportation, retail, hospitality, and health care sectors are all lower than average, making employees in these industries among the least expensive to cover. This is typically due to the lower average age among this workforce combined with less rich plans. After a large 5.6% increase last year, the manufacturing sector experienced only a slight increase this year. The technology sector had the largest cost increases this year (6.6%).
Employee Contributions by Industry
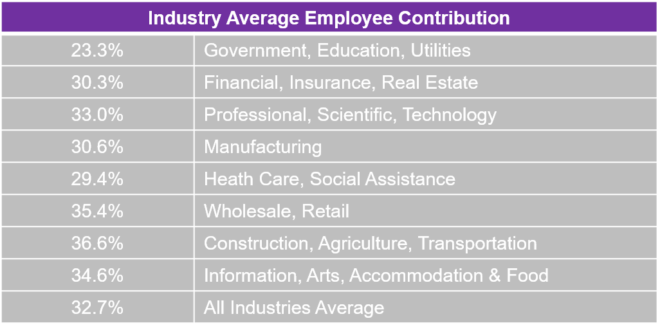
Employees, on average, contribute 32.7% toward total plan costs in 2019 vs. 31.2% in 2018. Some industries differ significantly from this typical 70/30 employer/employee split. Government employers pass on the least cost to employees (while offering the richest plans), who contribute only 23.3%, on average, toward the total costs. The construction/transportation industry passes on the most cost to employees, who pick up 36.6% of the tab.
 As a member of United Benefit Advisors, we can provide you with data from the nation’s most comprehensive benchmarking survey of health plans — the UBA Health Plan Survey. By using this data, we can help you more accurately evaluate costs and contrast your current benefit plan’s effectiveness against other companies’ plans by industry, size and region — giving you a distinct competitive edge in recruiting and retaining a superior workforce. Armed with this vital information, we can help you craft a superior benefits package that supports your strategic and financial goals.